December 2008

Ding It's up!
by 1 other (via)Ding It's Up is a free service that alert's you via text (SMS) or email when a website goes down or when it comes back up. We will never send you a text/email unless it is to inform you about a website you information for - you can unsubscribe at any time. If you would like to talk to us just email us at [email protected] - Thanks!
November 2008
Install and Configure Cacti Monitoring tool in Ubuntu 8.10 (Intrepid Ibex) Server -- Ubuntu Geek
(via)Cacti is a complete network graphing solution designed to harness the power of RRDTool’s data storage and graphing functionality. Cacti provides a fast poller, advanced graph templating, multiple data acquisition methods, and user management features out of the box. All of this is wrapped in an intuitive, easy to use interface that makes sense for LAN-sized installations up to complex networks with hundreds of devices.
September 2008

Monitoring Bandwidth Usage for a Xen node @ IONCANNON
After my last post on limiting bandwidth usage on a Xen node I thought I would follow up with how to monitor the bandwidth usage of a Xen node.
I chose to use netacct-mysql to monitor bandwidth and store the results into a mysql database. This isn't the only way of monitoring the bandwidth but it was easy to set up and stores the information directly into mysql without needing any extra scripts.
On the Xen setup I'm using for an example there are 3 nodes and a bucket for each node will be created in the mysql database by netacct. Setting up netacct can be tricky so you will want to check to make sure traffic for each node is going into the correct bucket.

Installation de Zenoss sous GNU/Linux
Tout comme Nagios, Zenoss est un outil de supervision open-source gratuit (il existe une version commerciale comportant plus d’options). Il se base sur une application Web qui va surveiler les noeuds de votre réseau et générer des rapports si chers aux yeux des décideurs informatiques…

WiFiDog - Trac
by 2 othersThe Wifidog project is an open source captive portal solution. As such, it has three main functions:
1. Location-aware delivery of internal or external content
2. Authentication and authorization
3. Centralized network monitoring
August 2008

Managing Xen using the xm Command-line Tool - Techotopia
In previous chapters we have covered the steps necessary to install and configure Xen and Xen based guest operating systems. This chapter is dedicated to explaining the xm tool, and how it can be used to manage guest operating systems from the command-line. If you prefer to use the graphical virt-manager tool to administer your Xen configuration see Managing and Monitoring Fedora based Xen Guest Systems.
Contents
* 1 xm Command-line vs xm Shell
* 2 Listing Guest System Status
* 3 Starting a Xen Guest System
* 4 Connecting to a Running Xen Guest System
* 5 Shutting Down a Guest System
* 6 Pausing and Resuming a Guest System
* 7 Suspending and Resuming a Guest OS
* 8 Saving and Restoring Xen Guest Systems
* 9 Rebooting a Guest System
* 10 Configuring the Memory Assigned to a Xen Guest OS
* 11 Migrating a Domain to a Different Host
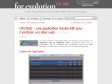
URLTestr : une application Adobe AIR pour monitorer vos sites web | For Evolution On AIR - Toutes les applications et l'actualité d'Adobe AIR en un seul blog
ne application AIR de monitoring Web. Initialement prévu pour la présentation, elle va finalement être développée comme une réelle application. En attendant la version final, la version bêta est disponible.

About Opsview | opsview.org
by 1 otherOpsview is enterprise network and application monitoring software designed for scalability, flexibility and ease of use. Opsview has been in development since 2003 and is released under the GNU GPL license. Current version is 2.12.
Opsview is a fully integrated monitoring tool that incorporates popular Open Source software including Nagios, Net-SNMP and RRDtool. The Catalyst web framework provides an extensible monitoring and configuration user interface.
Opsview software is supported on Linux (Debian, CentOS, RHEL and Ubuntu) and Solaris 10. It will monitor all common operating systems including Windows.
Opsview extends the capabilities of Nagios in the following ways:
* Distributed monitoring with high availability and fail-over
* Much improved SNMP support with trap processing with rules engine
* API supporting automation of Opsview configuration
* Data warehouse for storage of historical performance and event data
* Opsview Reports customisable reporting
* Powerful configuration and management UI
* Extended monitoring UI
* Extensible architecture based on Catalyst Web Framework and Altinity middleware software
March 2008
Supervisor - Home
by 4 othersSupervisor is a client/server system that allows its users to monitor and control a number of processes on UNIX-like operating systems.
It shares some of the same goals of programs like launchd, daemontools, and runit. Unlike some of these programs, it is not meant to be run as a substitute for init as "process id 1". Instead it is meant to be used to control processes related to a project or a customer, and is meant to start like any other program at boot time.
February 2008
Globule: the Open-Source Content Distribution Network
by 1 otherGlobule is a third-party module for the Apache Web server that allows a given server to replicate its documents to other Globule servers. It takes care of maintaining consistency between the replicas, of monitoring the servers, and of automatically redirecting clients to one of the available replicas. Globule also supports the replication of PHP documents. It runs on Unix and Windows systems.
January 2008

Create Disk Usage Reports with durep -- Ubuntu Geek
urep is a perl script used for disk usage reports. It can generate text output with bar graphs to allow easy comparisons of disk usage between directories. It can also generate web pages which can be navigated through the directory structure. This allows easy visual monitoring of disk usage. durep was designed for monitoring disk usage in a more visual way than du. The du program works fine but doesn’t allow a lot of control over how the results are displayed. This perl script is designed to produce output more useful for reports.

Monitoring File Uploads using Ajax and PHP - PHP articles and tutorials, MySQL, PostgreSQL
by 1 otherBecause of the limitations of HTTP, it is difficult to monitor the status of files as they are uploaded via HTML forms. While other programming languages have built-in methods to monitor file uploads, PHP does not. This article shows how to implement such a solution in PHP.
In order to achieve this, the APC (Alternative PHP Cache) PHP extension is required, as well as PHP 5. Specifically, APC 3.0.13 or newer and PHP 5.2 or newer are required for the code in this article to work. We will cover installation of APC in the next section. It is assumed you already have a working PHP 5.2 installation.

XEN Server Status Monitoring Command Cheat Sheet
The xm command is the main command line interface for managing Xen guest domains. The program can be used to create, pause, and shutdown domains. It can also be used to list current domains, enable or pin VCPUs, and attach or detach virtual block devices.
December 2007
spamdyke: A drop-in connection-time spam filter for qmail
spamdyke is a filter for monitoring and intercepting SMTP connections between a remote host and a qmail server. Spam is blocked while the remote server (spammer) is still connected; no additional processing or storage is needed.
MySQL Performance Monitoring Tool by Quest Software
by 1 otherSpotlight® on MySQL diagnoses MySQL problems in real time by graphically displaying all database activity in an intuitive user interface, enabling you to respond quickly to issues that need attention.
With Spotlight on MySQL, DBAs or developers running Windows can drill down to locate in-depth information on the source of a performance issue. And because the run-time nature of your MySQL databases is unique, Spotlight calibrates itself to a baseline of normal database activity.
This allows Spotlight to automatically establish the speed of the internal flows and other activity indicators. When a threshold is met, Spotlight notifies you using a visual or audible alert.
Spotlight on MySQL supports MySQL versions 5.0 or later that employ the InnoDB storage engine.
November 2007

Systems and Application Management Software Product Overview for Hyperic HQ | Products Home
Hyperic software is purpose-built to maximize availability of the Next Generation Data Center, where the demands of SOA, virtualization and composite applications are changing the pace and complexities of managing the data center. Everything is more compressed, more utilized, more integrated, more critical. The traditional tools IT operators used to monitor systems feebly cope with this new market landscape. This is where Hyperic comes in.
September 2007

Monitoring Network Latency With Smokeping (Debian Etch) | HowtoForge - Linux Howtos and Tutorials
This guide shows how to install and configure Smokeping on Debian Etch to monitor network latency. From the Smokeping web site: "SmokePing is a deluxe latency measurement tool. It can measure, store and display latency, latency distribution and packet loss. SmokePing uses RRDtool to maintain a longterm data-store and to draw pretty graphs, giving up to the minute information on the state of each network connection."

August 2007

Centreon Nagios monitoring V1.1 - VMTN Virtual Appliances
Centreon is a network, system, applicative supervision and monitoring tool, it is based upon the most effective Open Source monitoring engine : Nagios. Centreon provides a new frontend and new functionnalities to Nagios.Image
It ables you to be more efficient in your network monitoring, but also allows you to make your supervision informations readable by a largest range of users. Indeed, a non technical user can now use the Centreon/Nagios couple to easily understand your network infrastructure thanks to charts and graphical representations of the gathered informations.
Although, skilled users still have access to the technicals informations collected by Nagios.
Centreon was released for three years, and has already conviced most of its everyday users. Oreon has became a reference as a Nagios Frontend.
The Centreon/Nagios couple is used by a wide range of users, from novices to skilled users, even if they didn't knew Nagios before.

NagiosVMA - VMTN Virtual Appliances
NagiosVMA is virtual machine appliance that runs Nagios, a powerful, open-source application which performs host, service and network monitoring. Additionally, the appliance was enhanced with Groundwork Monitor Architect, an open-source, web-based, configuration tool for Nagios. It is intended to offer the end-user sophisticated network monitoring in minutes, instead of hours, (or even days) as is typical with building and configuring a Linux/Nagios host. Using Nagios combined with Monarch and Monarch's automatic host discovery feature, this virtual machine appliance can be booted, configured, and ready to monitor your network in as little as 10 minutes. (in fact, as soon as it boots, its already monitoring this virtual machine appliance!)

VMOSSIM - VMTN Virtual Appliances
This virtual appliance contains a ready to use ossim deployment. For detailed information about OSSIM please refer to http://www.ossim.net
Ossim stands for Open Source Security Information Management. Its goal is to provide a comprehensive compilation of tools which, when working together, grant a network/security administrator with detailed view over each and every aspect of his networks/hosts/physical access devices/server/etc...
Besides getting the best out of well known open source tools, some of which are quickly described below these lines, ossim provides a strong correlation engine, detailed low, mid and high level visualization interfaces as well as reporting and incident managing tools, working on a set of defined assets such as hosts, networks, groups and services.

July 2007

How-To: Monitor your servers with SNMP and Cacti
by 1 otherSNMP (Simple Network Management Protocol) is a protocol for managing networks. Each managed entity in the network will run an snmp server (snmpd) which is going to collect datas from the server such as networking, load, cpu ...
Cacti on the other hand is a frontend to the RRDTool with SNMP support. It collects and keep data in a MySQL database and display them through a PHP web frontend.
