2012
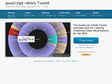
JavaScript InfoVis Toolkit
by 2 othersThe JavaScript InfoVis Toolkit provides tools for creating Interactive Data Visualizations for the Web.

2008
2007
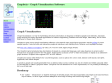
PyQwt plots data with Numerical Python and PyQt
PyQwt is a set of Python bindings for the Qwt C++ class library which extends the Qt framework with widgets for scientific and engineering applications. It provides a widget to plot 2-dimensional data and various widgets to display and control bounded or


Processing 1.0 (BETA)
by 41 othersProcessing is an open source programming language and environment for people who want to program images, animation, and interactions. It is used by students, artists, designers, researchers, and hobbyists for learning, prototyping, and production. It is c
2006

1
(8 marks)
