December 2009

November 2009


Flare | Data Visualization for the Web
Flare is an ActionScript library for creating visualizations that run in the Adobe Flash Player. From basic charts and graphs to complex interactive graphics, the toolkit supports data management, visual encoding, animation, and interaction techniques. Even better, flare features a modular design that lets developers create customized visualization techniques without having to reinvent the wheel.

Livre dont vous êtes le héros
As a child of the 80s, the Choose Your Own Adventure books were a fixture of my rainy afternoons. My elementary school library kept a low, fairly unmaintained-looking shelf of them hidden in one of its back corners. Whether this non-marquee placement was an attempt by the librarians to deemphasize the books in favor of ‘serious’ (children’s) literature or was simply my good luck I still haven’t worked out. But it meant there was a place that I could retreat to and dive into unfamiliar worlds without distraction.
MoodJam | Latest moods
MoodJam is a visualization of your moods and other people's moods. Use MoodJam to: * Keep a record of your moods every hour, day, and weeks—as often as you want, for as long as you want. * Visualize your moods in beautiful color strips. * Learn about trends in your moods and colors you associate with specific moods. * Share your moods with friends, family, co-workers, and other people who matter to you. MoodJam is a free service provided by the MoodJam Research Group in the Human Computer Interaction Institute at Carnegie Mellon University. We sometimes study how our members use MoodJam to learn how to improve personal and social awareness of moods. We promise to never give your personal information to anyone. See our privacy policy for more information.

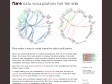
Websites as graphs - an HTML DOM Visualizer Applet
Generate a visual representation of a website DOM. An coloured, animated tree-node graph unfolds showing the structure of a site, based on what HTML tags it uses. Quite a beautiful visualisation. See author's blog entry on the applet at: http://www.aharef.info/2006/05/websites_as_graphs.htm Annotated link http://www.diigo.com/bookmark/http%3A%2F%2Fwww.aharef.info%2Fstatic%2Fhtmlgraph%2F


October 2009

oostring/weblog » Roadtrip poster final
This poster (800×1000mm) was designed to summarize and explain the summer holiday of 2009: a roadtrip/ moving house expedition undertaken by my partner Marthe and I, from Norway to England and back. It started as a tool for keeping track of costs, but was developed into a full trip overview as more details were added. Key data such as cost, distance and time are presented in various ways to create a rich data log.


Raphaël—JavaScript Library
Raphaël is a small JavaScript library that should simplify your work with vector graphics on the web.


September 2009
Youtego Private Beta - Welcome to Youtego
Maybe...A page to represent yourself with webpages? Youtego is a new visual tool for self-visualization in the Internet. If you had to construct sentence with visual pictures how would you do?