2010


jQuery Sparklines
"This jQuery plugin generates sparklines (small inline charts) directly in the browser using data supplied either inline in the HTML, or via javascript."
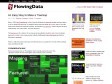
An Easy Way to Make a Treemap
"... a really easy way to make your own treemap in just a couple lines of code with R."
2008

2006
Page sans titre
Fonds de cartes destinés à représenter des données statistiques.

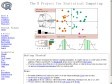
US Stats Population 2000 - Ethnic and Age Distribution
L'exemple parfait de ce qu'on peut faire avec SVG et Javascript pour afficher des statistiques sur une carte.
Enfin, il serait vraiment parfait si ça fonctionnait sous autre chose que Internet Explorer et Adobe SVG Viewer!
The R Project for Statistical Computing
R is a free software environment for statistical computing and graphics. It compiles and runs on a wide variety of UNIX platforms, Windows and MacOS
2005

Technologies du Langage: Outil: Le Chronologue
Le Chronologue est un outil qui permet de visualiser de façon graphique l'évolution de termes sur le Web francophone au cours du temps
1
(8 marks)