2013

2012

2010


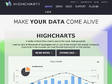
RGraph: HTML5 canvas graph library based on the HTML5 canvas tag
Interactive javascript canvas graphs using the HTML5 canvas tag for all platforms
2008

flot - Google Code
Flot is a pure Javascript plotting library for jQuery. It produces graphical plots of arbitrary datasets on-the-fly client-side.
2007

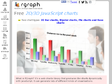
Nexen.net : portail PHP et MySQL - Plotkit : des camenberts en JavaScript
Renaud Drousies signale une petite merveille javascript : Plotkit, de liquidx. Cette bibliothèque JavaScript permet de créer des graphiques en ligne, directement. Au lieu de produire les images sur le site PHP, il est possible d'envoyer directement les données dans le javascript, et de laisser le navigateur faire le rendu.
Liquidx produit des courbes, des camenberts ou des barres. La bibliothèque est capable de produire des fichiers SVG ou HTML canva, et est compatible avec Safari 2, Firefox 1.5, Internet Explorer 6 et Opera 9.

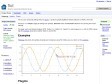
solutoire.com | Plotr
Some time ago I was looking for a charting framework for Prototype and I couldn’t find it, just because there’s none. So that’s where it all started. I came across PlotKit, a well written piece of javascript that enables developers to use Canvas or SVG elements for rendering bar, line and pie charts. The only thing was that PlotKit needed the Mochikit library to work. So I took some parts of PlotKit and wrote some parts myself. The result is a lightweight charting framework (12kb!) named Plotr. It’s released under the BSD license.
1
(12 marks)

