2019
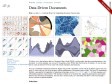
GitHub - jwilber/roughViz: Reusable JavaScript library for creating sketchy/hand-drawn styled charts in the browser.
Reusable JavaScript library for creating sketchy/hand-drawn styled charts in the browser.
2012

Piecon / Pie charts in your favicon!
A tiny javascript library for dynamically generating progress pie charts in your favicons.
2011
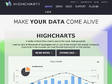
Highcharts - Interactive JavaScript charts for your webpage
A js graphical library for drawing charts. It stands on top of jQuery, MooTools or Prototyp, depending on the host project fundations, and provides a large serie of nice colored animated charts.
Highcharts - Interactive JavaScript charts for your webpage
Statistik - visuelle Darstellung per JavaScript - Diagramme - Torten - Balken
MMM
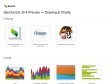
Drawing & Charts | Sencha Ext JS 4 Preview
An extjs library, which allows drawing and creating charts in a rather easy programmting way.
2010


Grafico javascript charting library
Grafico is a javascript charting library based on Raphaël and Prototype.js.
2009


Highcharts - Interactive JavaScript charts for your webpage
Highcharts is a charting library written in pure JavaScript, offering an easy way of adding interactive charts to your web site or web application. Highcharts currently supports line, spline, area, areaspline, column, bar, pie and scatter chart types.


gRaphaël—Charting JavaScript Library
gRaphaël’s goal is to help you create stunning charts on your website. It is based on Raphaël graphics library.


JS charts – The free JavaScript chart generator
Another js charting library. But this one doesn't use canvas nor SVG, it creates png as dataurls, and seems rather fast. The main forepoint is that it works out of the box in most of the browsers of the market.

jQuery Sparklines
This jQuery plugin generates sparklines (small inline charts) directly in the browser using data supplied either inline in the HTML, or via javascript.
2008


2007
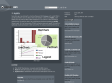

Charts And Graphs: Modern Solutions | Developer's Toolbox | Smashing Magazine
Server-based solutions, implemented with Flash, JavaScript or pure CSS, offer a more flexible alternative. In fact, since Flash offers significant advantages over static data presentation with CSS and JavaScript, most solutions use it for dynamic data visualization. The data itself is often stored in XML-files which are loaded and updated via PHP or ASP. The price range varies enormously — depending on the flexibility and level of customization you’d like to have. However, if you don’t want to pay, you don’t have to — there are powerful free solutions as well.


