2010

Data in, Brilliance Out | Tableau Public
(via)Within minutes you can create an interactive visualization and embed it in your website or share it. Anyone can do it, it’s that easy—and it’s free.
2009
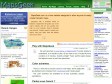
Map your data ! - MapsGeek
(via)MapsGeek.com est un site gratuit qui vous permet de concevoir des cartes thématiques.
Avec son grand nombre de fonctionnalités, MapsGeek vous guide lors de la conception de votre carte et vous permet de la publier facilement sur votre blog, site, articles, rapports etc... Créez votre couche, importez-en une ou d'utilisez celles déjà présentes, importez vos données, réglez leur représentation, c'est tout !!!
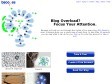
Bscopes: Mining, Mapping and Visualizing the Blogosphere
(via)Bscopes will help you cut through the clutter of too many blog RSS feeds to read. A Bscope gives you a visual map of each blog. In less than 30 seconds you can see what it can do for you. Sign up for your free account or take a tour.
2008
pajek [Pajek Wiki]
Pajek (Slovene word for Spider) is a program, for Windows, for analysis and visualization of large networks. It is freely available, for noncommercial use
2007

yEd - Java Graph Editor
by 7 others (via)yEd is a very powerful graph editor that is written entirely in the Java programming language. It can be used to quickly and effectively generate drawings and to apply automatic layouts to a range of different diagrams and networks.
2006
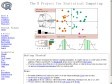
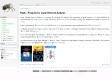
The R Project for Statistical Computing
by 12 othersR is a free software environment for statistical computing and graphics. It compiles and runs on a wide variety of UNIX platforms, Windows and MacOS
2005

MindRaider - Semantic Web Outliner
by 3 others (via)Mindraider est un outil d'organisation personnelle utilisant des méta-données pour tagger vos documents. Il est gratuit et semble vraiment intéressant. Ressemble à TheBrain

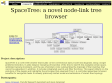
Tulip Software home page
by 1 otherTulip is a software system dedicated to the visualization of huge graphs. It manages graphs with up to 500,000 elements (node and edges) on a personal computer (PIII 600, 256MB RAM).
2004

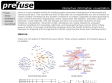
prefuse: an interactive visualization toolkit
by 5 others"prefuse is a user interface toolkit for building highly interactive visualizations of structured and unstructured data. This includes any form of data that can be represented as a set of entities (or nodes) possibly connected by any number of relations (

1
(14 marks)