2010
Highcharts
"Highcharts is a charting library written in pure JavaScript, offering an easy way of adding interactive charts to your web site or web application."
2009

Protovis
Protovis composes custom views of data with simple marks such as bars and dots. Unlike low-level graphics libraries that quickly become tedious for visualization, Protovis defines marks through dynamic properties that encode data, allowing inheritance, scales and layouts to simplify construction.
Protovis is free and open-source, provided under the BSD License. It uses JavaScript and SVG for web-native visualizations; no plugin required (though you will need a modern web browser)! Although programming experience is helpful, Protovis is mostly declarative and designed to be learned by example.
2006

SIMILE | Exhibit
Exhibit is a lightweight structured data publishing framework that lets you create web pages with support for sorting, filtering, and rich visualizations by writing only HTML and optionally some CSS and Javascript code.

US Stats Population 2000 - Ethnic and Age Distribution
L'exemple parfait de ce qu'on peut faire avec SVG et Javascript pour afficher des statistiques sur une carte.
Enfin, il serait vraiment parfait si ça fonctionnait sous autre chose que Internet Explorer et Adobe SVG Viewer!

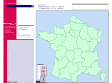
AkryliK - cartographie SVG et données sur la France par Julien Thenaisie étudiant en Géomatique
CARTOGRAPHIE INTERACTIVE EN SVG
2004
1
(6 marks)